

A major player in the quantum computing industry needed to identify where to focus its R&D efforts across algorithms and fabrication processes.
The scope covered four qubit modalities: superconducting, photonic, spin, and neutral atoms. The client wanted to understand the global innovation landscape and find areas with limited patent activity but high innovation potential.
The challenge was not a shortage of data. The quantum computing patent landscape contained thousands of patent families across hundreds of assignees. The challenge was separating genuine whitespace from areas that looked empty because researchers had abandoned them.
11,500+ Patent Records Analyzed Across Quantum Algorithms, Fabrication, and Qubit Modalities
The study covered patent families with earliest priority dates from January 2013 onward, spanning global filings across all four qubit modalities.
The team built two structured taxonomies before collecting data. The algorithm taxonomy covered nodes such as core algorithmic primitives (quantum Fourier transform, amplitude amplification, phase estimation), quantum error correction (concatenated codes, topological codes, bosonic codes), etc.
The fabrication taxonomy covered nodes such as deposition methods (physical and chemical vapor deposition), lithography, thin-film etching (dry etching, wet etching, hybrid techniques, advanced techniques), etc.
Each taxonomy node was classified as an emerging area, a broad concept, or a mature/established research area. The primary analytical focus was on emerging techniques where patenting remained limited, but signals pointed to the next wave of innovation.
The analysis separated fabrication patents into three tiers. A significant portion of fabrication-related patents fell under broad fabrication concepts, where disclosures focused on high-level device structures without detailing specific manufacturing steps. Another large cluster represented established research areas concentrated around mature methods. Only a filtered subset represented emerging fabrication techniques with whitespace potential. The same separation was applied to algorithms, where many filings focused on hardware architectures that merely referenced algorithms rather than advancing them.
Patent Gaps Alone Could Not Distinguish Opportunity from Dead End
Some areas carry few patents because no one has found a way to make the physics work at scale. Others carry few patents because the technology is so new that no one has filed yet. A conventional landscape analysis treats both the same way: low patent count equals opportunity. That assumption can direct R&D budgets toward dead ends.
The client faced a second problem layered on top of the first. Even when a whitespace was genuine, the client had no way to decide when to invest. Some underpopulated areas would fill up quickly. Others would take five or more years to become commercially relevant. Without a timing framework, every opportunity looked equally urgent.
The analysis had to do three things simultaneously: separate real whitespace from abandoned territory, validate each shortlisted area against external industry signals, and classify opportunities by investment timing.
Reverse Validation Linked Industry Signals to Patent Data
A conventional patent landscape starts from filings, identifies gaps, and assumes those gaps are opportunities. This engagement inverted that sequence.
Instead of starting from patent data and looking for empty spaces, the team started from industry signals and worked backwards to IP validation. Emerging technologies were first identified through patents and non-patent literature (research papers, whitepapers, conferences, roadmaps). Those candidates were then validated against their real-world industry impact. Only areas that survived both filters qualified as actionable whitespace.
Typical Approach: Analyze full patent landscape, find areas with low patents, assume those are opportunities, recommend all of them. The flaw is that empty spaces in IP do not automatically mean opportunity. This would have taken a lot of effort in the process.
Reverse Validation Approach: Scan industry for emerging signals, validate against roadmaps and conferences, cross-check with IP data, recommend only validated areas.
This framework operated in five phases:
| Phase | Question Asked | Decision It Addressed |
| Taxonomy Construction (Foundation) | How should the quantum computing domain be structured before any data is collected? | The team built structured taxonomies for algorithms and fabrication by extracting emerging signals from patents, research papers, whitepapers, conferences, and technology roadmaps. This defined the analytical boundary and narrowed the field before any detailed analysis began. |
| Horizon Scanning (Scope) | Which areas within the taxonomy show emerging innovation signals? | Search strategies combining keywords with CPC and IPC classifications were designed for each taxonomy node across all four qubit modalities. The extracted dataset was screened to separate emerging techniques from broad concepts and mature research areas, isolating the subset where patenting remained limited but signals pointed to the next wave of innovation. |
| Market Validation (Strategic) | Does low patent activity in a given area signal opportunity or a dead end? | Candidate whitespaces were cross-referenced against their industry impact based on quantum roadmaps, major conference agendas, government-funded programs, and global consortium goals. Areas that showed no external validation were filtered out. |
| Competitive Positioning (Intelligence) | Where have competitors already built positions, and where are the gaps between them? | Competitors were classified by innovation intensity and filing recency across qubit modalities and technology sub-domains. Collaboration patterns, licensing activity, and government support signals were tracked to add context beyond raw filing data. |
| Prioritized Output (Decision) | Which validated whitespaces warrant investment, and on what timeline? | Validated whitespaces were mapped on two axes: IP strength and industry impact. Each was then classified by maturity into short-term, medium-term, and long-term opportunity windows. |
Validating Shortlisted Areas Against External Industry Signals
No area was shortlisted based solely on patent data. Each candidate technology was validated against multiple external signals to confirm genuine industry momentum.
The validation used four types of external evidence:
Industry roadmaps were checked for alignment between identified whitespace areas and consortium goals or company roadmaps. Conference activity was verified to confirm whether a technology was the subject of dedicated sessions at major conferences. Government investment was cross-referenced with government-funded programs and national quantum strategies. Expert validation was confirmed through whitepapers and industry reports from research institutes.
This validation changed the output. A fabrication technique that appeared as whitespace in the patent data was confirmed by a leading research institute as the enabling technology for the next era of qubit scaling. A deposition method was highlighted at a 2025 quantum workshop by speakers from two leading fabrication companies. An error mitigation technique was the subject of a dedicated session at a major physics conference. Without this validation step, these areas would have been indistinguishable from the dead ends surrounding them.
Mapping Competitor Activity by Innovation Intensity and Filing Recency
The competitive analysis went beyond patent counts. Competitors were classified into four archetypes based on two axes: innovation intensity (high versus low) and filing recency (majority filed before versus after 2020).
| Archetype | Profile |
| Established Players | Strong innovation activity in emerging areas supported by a mature and well-developed IP base. Majority of filings before 2020. |
| Upcoming Players | High innovation momentum driven by a sharp rise in post-2020 filings across emerging domains. |
| Passive Players | Limited activity in emerging areas, suggesting dependence on established technologies rather than active expansion. |
| Niche Players | Focused innovation in specific emerging areas, reflecting a specialized or highly targeted research direction. Often academia-driven. |

For each competitor of interest, the analysis mapped patent activity across qubit modalities, algorithm types, error correction approaches, and fabrication techniques. Collaboration patterns, licensing activity, and government support signals were also tracked to add context beyond raw filing data.
A Two-Axis Opportunity Map Consolidated All Findings Into a Single Decision Framework
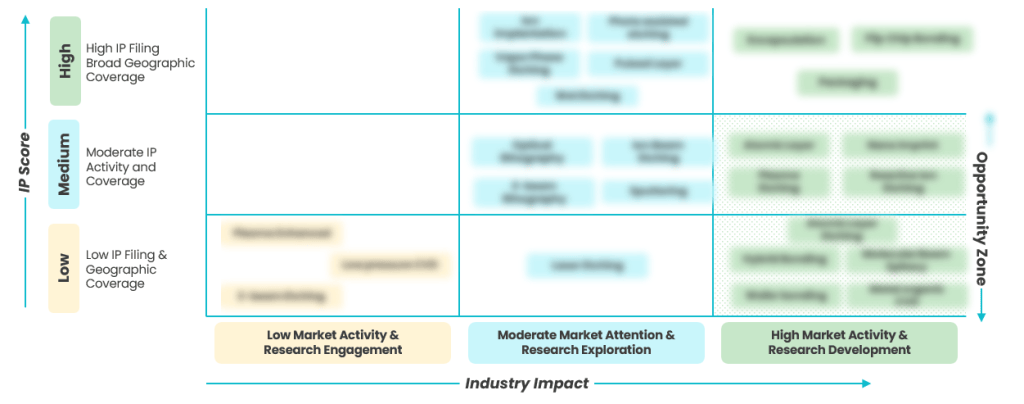
The analysis consolidated its findings into a single visual framework that plotted each emerging technology on two axes: IP score (filing volume and geographic coverage) and industry impact (validated through roadmaps, conferences, and consortium goals).
Technologies landing in the zone of high industry impact and low IP score represented the primary opportunity areas: genuine whitespace backed by validated industry momentum. Technologies in the high industry impact and high IP score zone were already competitive. Technologies with low industry impact regardless of IP score were deprioritized.
This framework gave the engagement’s output a structural advantage over a conventional landscape. A standard analysis produces a list of technologies ranked by patent count. This analysis produced a map where each position carried a validated decision signal.
Opportunities Were Classified into Three Time Horizons for Investment Sequencing
The final output layer addressed the timing problem. Whitespace was classified into three horizons:
| Horizon | Profile | Signal |
| Act Now (0 to 2 years) | Emerging areas where conferences and roadmaps already signal critical importance, but patent filings remain low. | Technologies flagged as critical for next-generation qubit scaling at recent industry workshops, yet patent density was still low. |
| Prepare (2 to 5 years) | Areas with moderate IP activity and strong future potential. | Manufacturing processes where the focus needed to shift to proprietary process recipes and early filings. |
| Watch (5+ years) | Technologies important for mass production and yield improvement. | Techniques for fixing defects and lowering cost per qubit as the industry scales. |
This classification allowed the client to allocate R&D budget across short, medium, and long-term windows instead of treating every opportunity as equally urgent.
A Validated Whitespace Map, Not a Patent Gap List
The engagement produced an output that conventional landscape analysis does not deliver. A standard analysis identifies areas with low patent counts and presents them as opportunities. This analysis validated each candidate against external industry signals before it qualified, filtered out false positives where low patent activity reflected dead ends rather than genuine opportunity, mapped competitors by strategic archetype rather than filing volume, and classified every opportunity by investment timing.
The false-positive filter and external validation prevented pursuit of areas that looked open on paper but had no industry future. By narrowing the relevant patent universe from thousands to hundreds of emerging technique families, the analysis reduced exploration time. The time-horizon classification and opportunity map provided a framework for making investment decisions rather than delivering a list of technologies.
Want to Identify Genuine Innovation Whitespace in Quantum Computing?
Finding areas with low patent activity is not the same as finding opportunity. Some areas are empty because the technology has been abandoned. Others are empty because the technology is too new for anyone to have filed. The difference determines whether R&D investment builds a defensible position or pursues a dead end.
A structured whitespace analysis validates each candidate area against industry roadmaps, conferences, government programs, and expert research before qualifying it as an opportunity. It classifies opportunities by investment timing and maps them against competitive positioning to show where filing activity would land relative to existing players. This is what separates a patent landscape analysis from a patent gap list that treats every empty space as equally promising.
GreyB helps technology and IP teams move from broad patent landscapes and raw data to validated innovation opportunities backed by industry-confirmed signals.