Traditionally, the Australian economy has been highly dependent on mining operations and farming. Although consistent innovation is happening in the mining sector, the other sectors are being hugely neglected.
In comparison with the other OECD (Organization for Economic Co-operation and Development) countries, R&D investment by both private and government entities is low in Australia. Often used as a key parameter for innovation, the patent filing in Australia has also significantly decreased in comparison with other OECD countries.
Recently, the mining industry has shown a scale down as well. Australia, thus, needs a full range of options in other sectors to boost innovation, commercialization of inventions and thus revenue generation.
That said, we tried to analyze the plunge by checking what the state of innovation in Australia is. We used the patent applications filed in the Australian Patent Office during the period 2010-15, for the analysis. The criteria that we used to gauge the state of innovation in Australia were as follows:
- Patent filing trend: The number of patents getting filed in a country help you gauge how it is performing in terms of research.
- Resident vs. Non-resident patents: The trend helps you gauge whether people of the country are driving the wagon of innovation or a company based out of some foreign country is responsible for it.
- Top countries involved in filing: Corresponding to the above criteria, which are the top foreign countries responsible for the patent filing.
- Top companies involved in filing: The criteria helps one understand the chief innovators in an economy.
- Top technologies: The criteria showcases most popular technologies in a country.
- Top law firms involved in filing: The criteria reveals which law firms were used by most of the companies in Australia. We can also refer to this as most in-demand patent law firms based out of Australia.
Patent Filing Trend in Australia
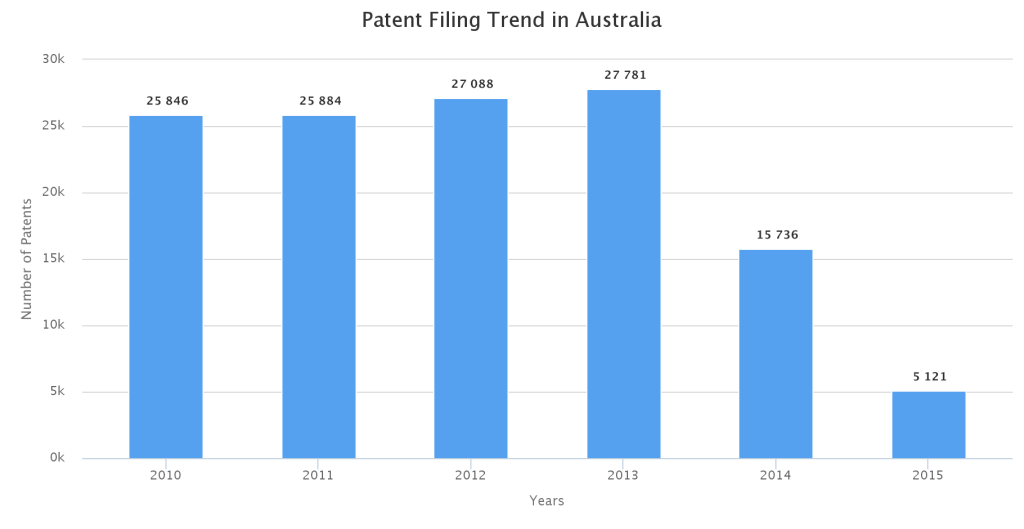
The chart below represents the patents filed in Australia during 2010-15. It could be seen that the number of applications filed has consistently risen from 2010 to 2013 with a total increase of 7.5% over the period of time.
Resident Vs Non-resident Patent Applications filed in Australia
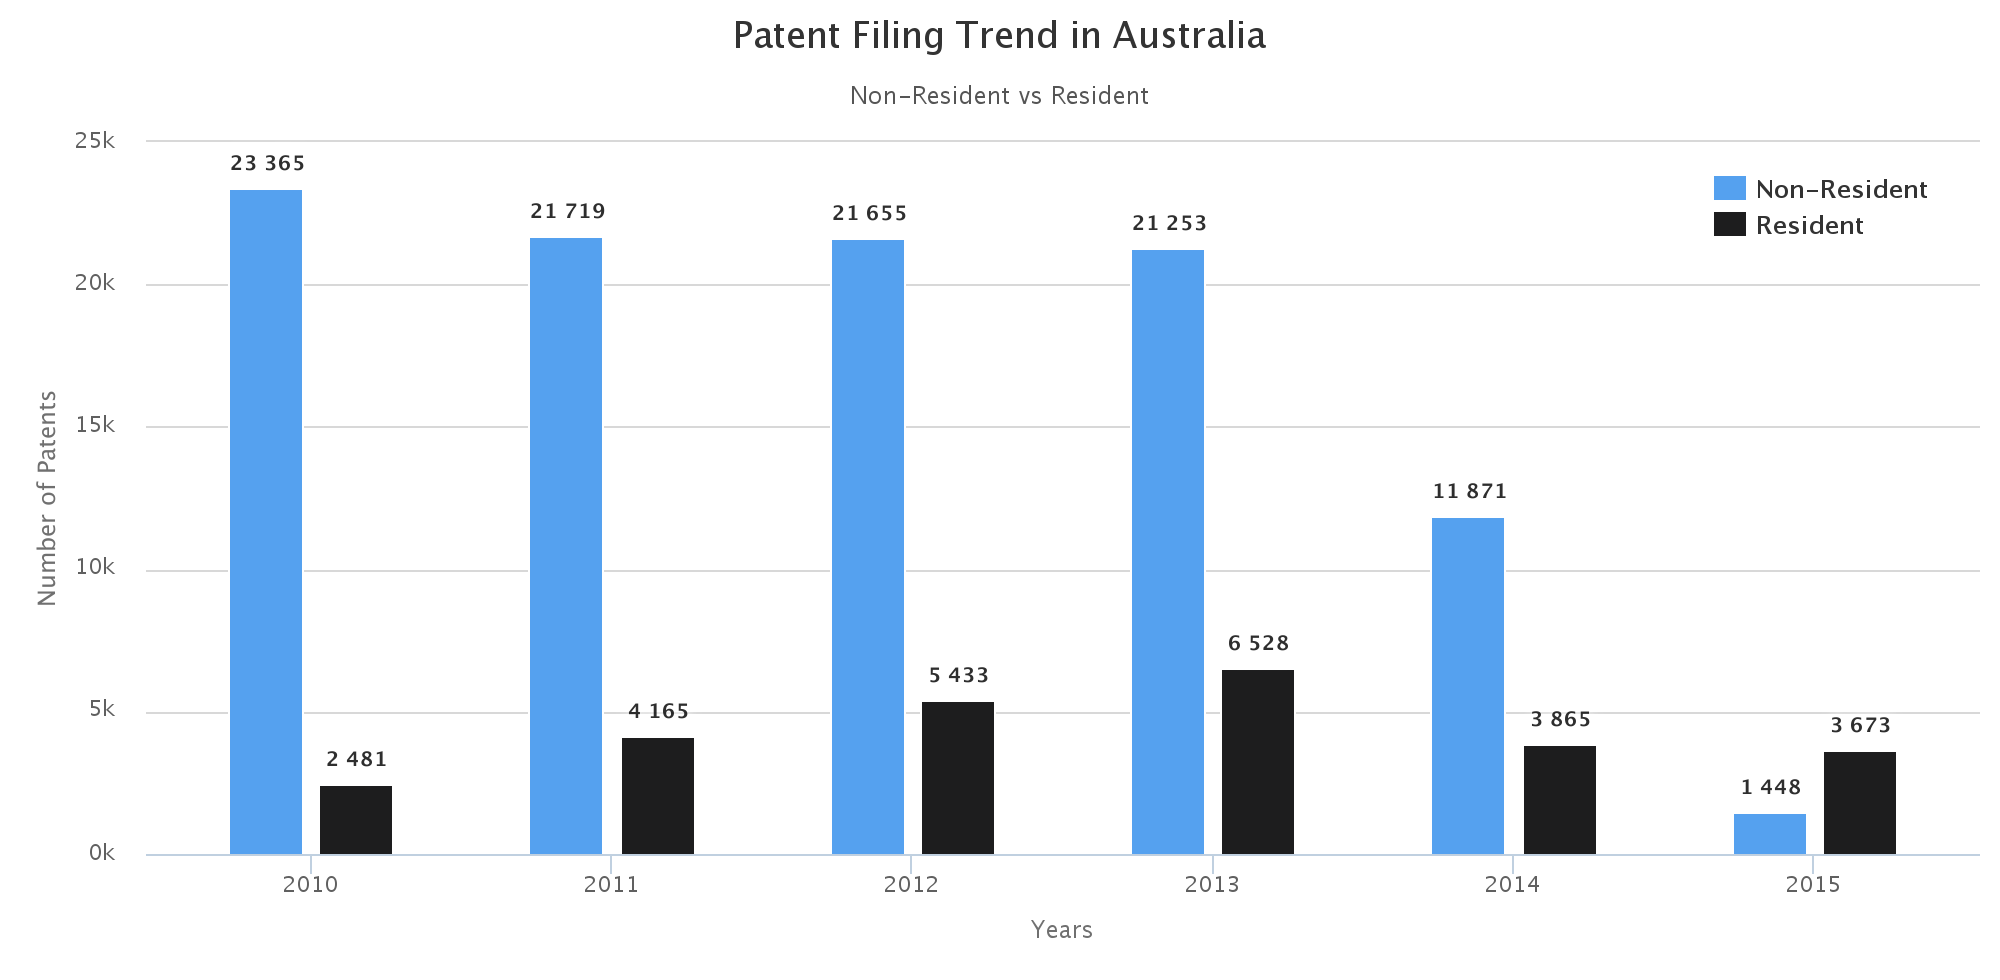
The chart below portrays that Australians companies were responsible for filing only 21% of the total patents while rest of the 79% patents were filed by foreign companies. Thus in the last five years, foreign innovators, in general, were majorly responsible for the innovation taking place in the country.
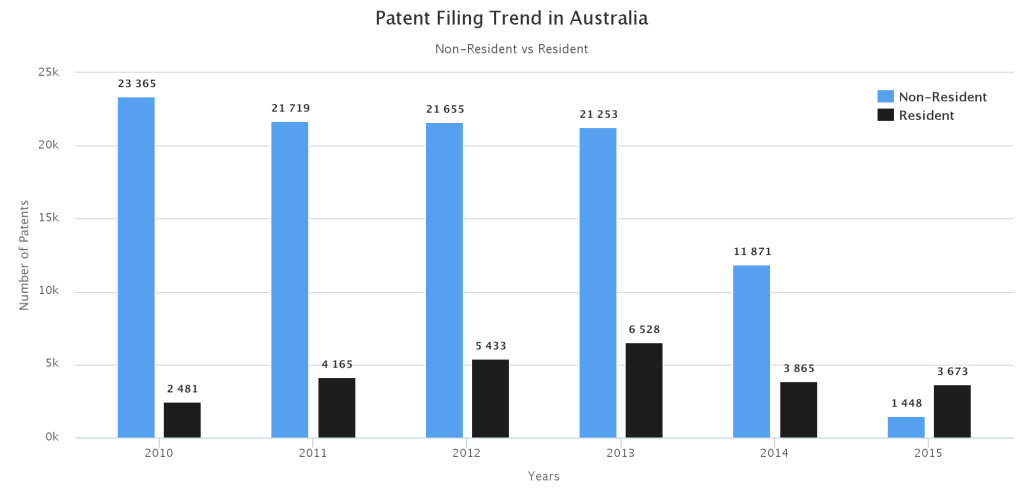
In case of Australian filers, there appears to be a steady rise with 2,481 applications filed in 2010 to 6,528 applications in 2013 denoting an increase of nearly 163%. This does indicate the growing interest of Australian filers in new inventions.
On the other hand, patents filed by foreign applicants decreased during the period. For example, foreign applicants accounted for 23,365 patents in 2010 which got reduced by 9% to 21,253 applications in 2013. The decrease didn’t make any significant change as the total number of patent applications filed in 2011 through 2013 remained almost same.
Priority Country-wise distribution of Patent Applications in Australia
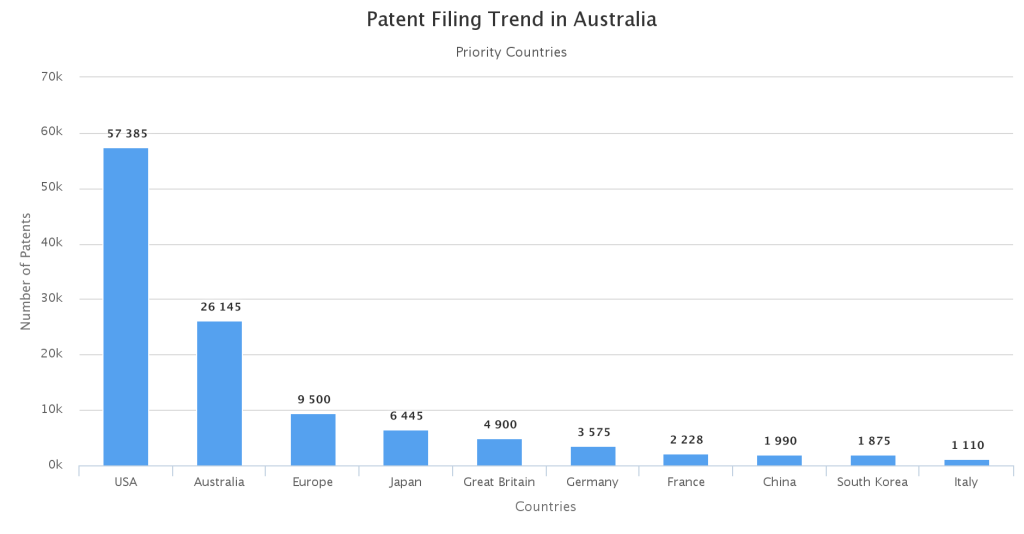
The United States of America claims the first spot as a priority country for most of the patents filed in Australia. It is followed by Australia itself while the European region claims the third place. Nearly 45% of all patents filed in Australia claim a US priority. While 20.6% of patents claim an Australian priority, only 7.5% of patents filed are from the European region and Japan follows close at 5%.
It can be argued that companies innovating in the US consider Australia a potential market for their products. The important question is which companies consider Australia as a potential market? I’m glad that you asked. The answer is in the next section.
Which companies are filing for protection in Australia?
The chart below depicts interests of various companies innovating in Australia or considering it as a potential market for their products between 2010-2015. As we were expecting, most of the top companies are either related to mining operations or technological sector (Tech products or software companies). Below listed are the companies filing the most patents in Australia.
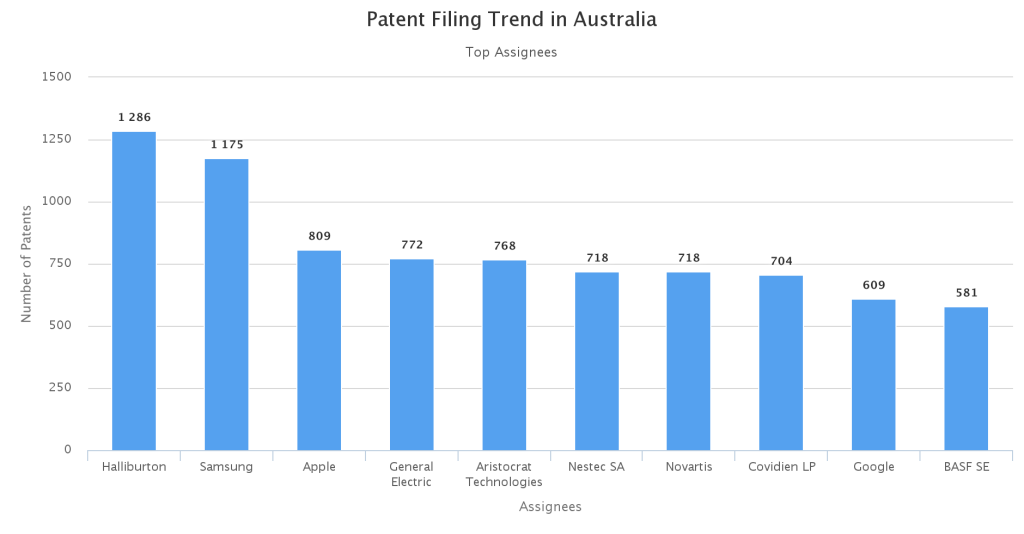
Halliburton
Halliburton with 1,286 patents is the top patent filer in Australia. Halliburton’s patent filing increased by 105% to 271 patents in 2012 compared to 2010. In the next year, however, the number of patents filed plunged to 159 depicting a decrease of 41%.
Halliburton, being a major oil field company, filed most of its patents in drilling and other mining equipment, like gravitational measurements, detecting masses of objects or analyzing their chemical or physical properties.
Samsung
Samsung with 1175 patents is the second top patent filer in Australia. Samsung’s increasing interest in Australian market can be gauged from the fact that their patent filing grew from 103 in 2010 to 330 in 2013, which is a 220% increase.
Samsung has filed most of its patent in digital data processing, followed by wireless and other communication networks. Filing in these domains remained steady for a while, however; the electrical digital data category registered a sharp increase with 114 patents in 2013 in comparison to 54 in 2012 indicating a 110% jump. The local telecom companies need to keep a close watch on Samsung.
Apple
Apple with 809 patents is at the third spot. According to a report by Kantar World panel ComTech, Apple’s Australian market share increased by 8.5% to 37.8% in the quarter ending on August 2015 in comparison to the same period in 2014. For the same period, the market share of Samsung’s Android-based devices fell by 1.4% to 33.7% as compared to the quarter ending on August 2014.
Covidien LP
Covidien LP is one company that has made a huge progress in term of patent filing in the last five years. It filed only 7 patents, in 2010, which increased to 268 in 2013.
Halliburton and Baker Hughes Acquisition
It would be interesting to look at the intellectual property synergies between Halliburton and Baker Hughes, respectively the second and third largest oilfield services providers in Australia (as well as the world), if the latter’s takeover is approved by the regulatory authorities in US, Asia, and Europe.
Looking at the patent filings in electric digital data processing technology by Apple, Samsung, and Google, it appears that there has been a consistent rise in the number of patents filed from 2010 to 2012.
It does give an indication that the three companies are innovating in the said technology and appear to be in neck to neck competition in the Australian as well as several global markets.
The Top Law firms prosecuting patents in Australia
The chart below represents law firms involved in patent prosecution activities in Australia.
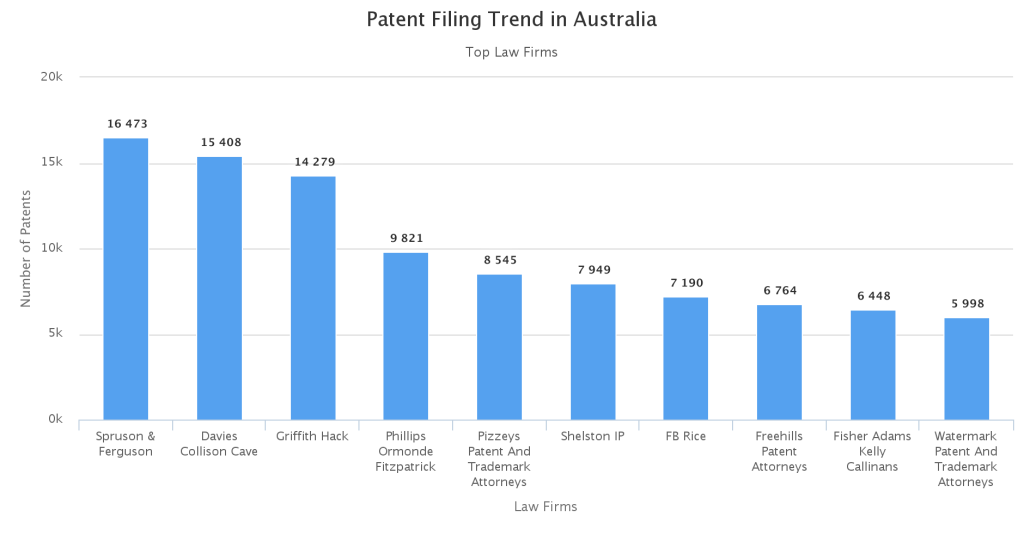
In the period 2010-15, Spruson & Ferguson sits at the top spot being responsible for filing 14.7% of the total patents in Australia followed by Davies Collison Cave with a 13.7% share. Griffith Hack holds the third spot with a share of 12.7%.
Year Wise Patent Statistics of Law Firms
The year wise patent prosecution statistic of Spruson & Ferguson appears to be stable from 2010 to 2013 while a growth of nearly 7.8% was registered in the period. Also, its share price tripled within a year after it got listed on the ASX in November 2014.
In case of Davies Collison Cave, there was an increase of only 3.7% in patent filing between 2010 and 2013, while there was a dip in patent prosecution by 8%. In case of Griffith Hack, the overall patent prosecution activity remained somewhat even.
It necessarily does not signify whether or not there has been an overall increase in innovation in Australia, that is, unless we correlate it with patent publishing data.
Feature Download: Download your copy of the “Patent Prosecution Trend – Germany” whitepaper: Click here to download
Top Technology domains in Australia
In order to find the popular technologies in the Australian region, we analyzed the IPC classes of the patents filed from 2010 to 2015. The region experienced highest patent protection in medical, chemical, and data processing technologies.
The top five technology domains under which most patents were filed are:
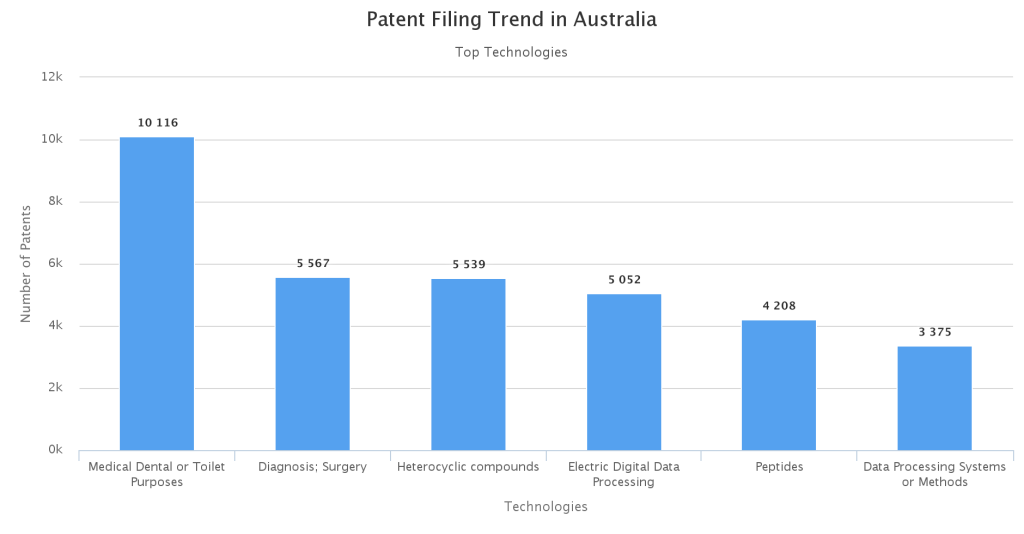
Preparations for Medical, Dental or Toilet Purposes:
- 15.7% of the total patents were filed in this technology domain.
- The number of patents filed in the technology class rose from 2097 in 2010 to 2388 in 2013 registering a 13.8% growth.
- Novartis AG filed the most patents in this domain from 2010-15. The company was closely followed by Allergan and Colgate-Palmolive. The other companies in order of highest number of patents filed are Johnson & Johnson, Nestec SA (Nestle), Boehringer Ingelheim and Merck Sharp and Dohme. It can thus be argued that much of the innovation in this technology domain is occurring in USA and Europe as compared to that in Australia.
Diagnosis; Surgery; Identification in relation to analysis of biological material:
- 8.66% of the total patents were filed in this domain.
- The year wise analysis shows a growth of only 0.5% from 2010 to 2013.
- Covidien appears to have been most active in pursuing patent protection in this technology domain followed by Tyco Healthcare and Ethicon Endosurgery. They were followed by Biosense Webster, Smith & Nephew and Cook Medical Technology. Covidien filed 565 patents while Tyco Healthcare filed 414 patents and Ethicon Endosurgery filed 293 patents from 2010 to 2015. This supports the fact that for Covidien (and Medtronic too), Australia is becoming an increasingly important market.
Heterocyclic compounds- macromolecular compounds:
- The share stands at 8.62% of the total patent filing.
- The technology domain experienced a dip in patent filing activity of nearly 7% between 2010 and 2013.
- Novartis AG filed the most number of patents- 177 followed closely by Hoffmann La Roche, Janssen Pharmaceutical, and Sanofi. It again signifies that most of the innovation in this technology domain is occurring outside Australia. In case of Sanofi, a peculiar trend is noticed – That is, its patenting activity in the domain has been decreasing YOY with 46 patent filings in 2010 in comparison to only 13 in 2013.
Authored By: Sumit Chakraborty, Senior Associate, IP Solutions

